
How to use Claude to build a full FP&A scenario analysis (with real SaaS data)
We gave Claude 24 months of SaaS data. Here’s everything it built.
Every FP&A manager has lost a week to scenario analysis.
The CEO walks in and asks what happens if revenue drops 20%. You say you’ll model it. Then you spend three days rebuilding tabs, fixing broken links between sheets, and chasing down assumptions from business partners who take 48 hours to respond to a Slack message.
By the time you deliver the analysis, the conversation has moved on. The decision already got made in a hallway. Your beautiful scenario model lands in someone’s inbox, gets a thumbs-up emoji, and never gets opened again.
We think that’s about to change, and this newsletter exists to show you how.
We took 24 months of real SaaS operating data and uploaded it to Claude. Then we spent an afternoon asking it the exact questions your CFO asks you, the ones that normally send you back to the spreadsheet for a week.
What happens if churn doubles?
What happens if we lose our biggest customers overnight?
Whether we can afford three new hires or if that destroys us in a downturn.
What came back was a full scenario dashboard with interactive charts, a churn stress test built on proper cohort math, a black swan simulation with a recovery playbook, a headcount decision model with a specific hiring trigger, and board-ready EBITDA guidance with leverage capacity across every scenario.
All of it came from one conversation, without a single VBA macro, without a circular reference, and without anyone staring at a broken consolidation tab at 11pm on a Sunday.
Here's how to use Claude to build the same thing with your data tomorrow morning.
Let’s dive in.
How to build a full scenario analysis with Claude
Step 1: Upload your data
We uploaded a CSV with 24 months of monthly operating data. Units, revenue, COGS, gross profit, OpEx, EBITDA, cash, churn rate, DSO, and average selling price.
PROMPT
You are a senior FP&A analyst. I’ve attached 24 months of operating data for a mid-market SaaS/product company.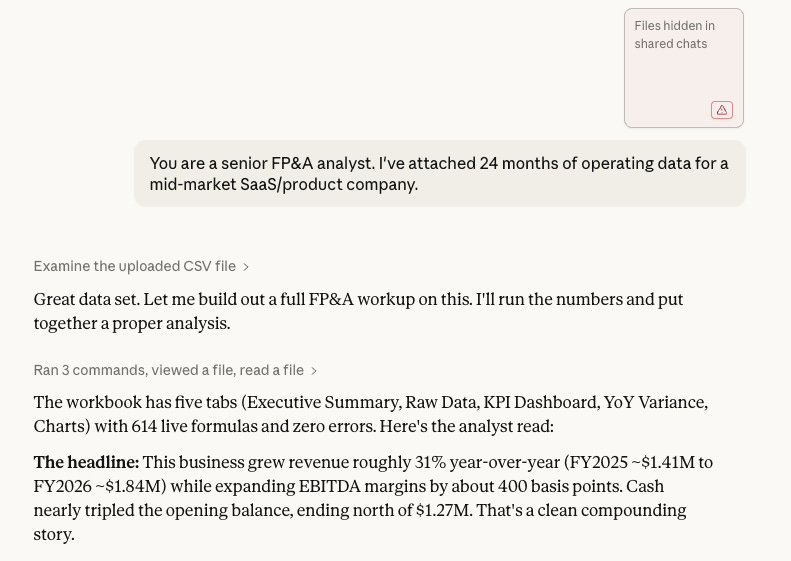
Claude came back with a five-tab workbook containing an executive summary, raw data, a KPI dashboard, YoY variance, and scenario charts. 614 live formulas, zero errors.
Two flags stood out immediately.
A recurring July-August seasonal dip where units pulled back 3-4% from June peaks, which means any straight-line forecast misses Q3.
Gross margins locked flat at 60% for all 24 months, so there’s no cushion on the cost line. If input costs move even 200 basis points, it hits EBITDA directly.
Step 2: Build scenarios with real assumptions
This is where most of us go wrong. Adjusting one number by a percentage isn't a scenario. A real scenario starts with something you believe could actually happen, and each one needs its own assumptions because each one hits your P&L differently.
We gave Claude distinct assumptions for each future:
PROMPT
Please do the following:
1. Analyze the base case data: Summarize trends in revenue, gross margin, EBITDA, churn, and cash position. Flag any inflection points or risks visible in the data.
2. Build three scenarios using these assumptions:*
Upside: - Unit growth: +4.0% MoM (vs. base ~2.5%) - Pricing: +$1.00/quarter (vs. +$0.50) - COGS: 38% of revenue (vs. 40%) - Opex growth: +0.3% MoM (vs. +0.5%) - Churn: declines to 2.0% by Month 24 - DSO: improves to 28 days
Downside: - Unit growth: +0.5% MoM - Pricing: flat (no increases) - COGS: 44% of revenue - Opex growth: +1.2% MoM - Churn: rises to 5.0% by Month 24 - DSO: extends to 45 days
3. For each scenario, project all fields for Months 1-24 and calculate: - Revenue run-rate (Month 24 annualized) - Gross margin % and EBITDA margin % at Month 24 - Ending cash position at Month 12 and Month 24 - Monthly cash burn/build rate (average of last 6 months)
4. Create a comparison table showing all three scenarios side by side on the key metrics above.
5.Provide a 3-paragraph executive summary written for a CFO: what does the data say, what are the decision points, and what should we monitor monthly. Format output with clear headers and tables. Be specific with numbers.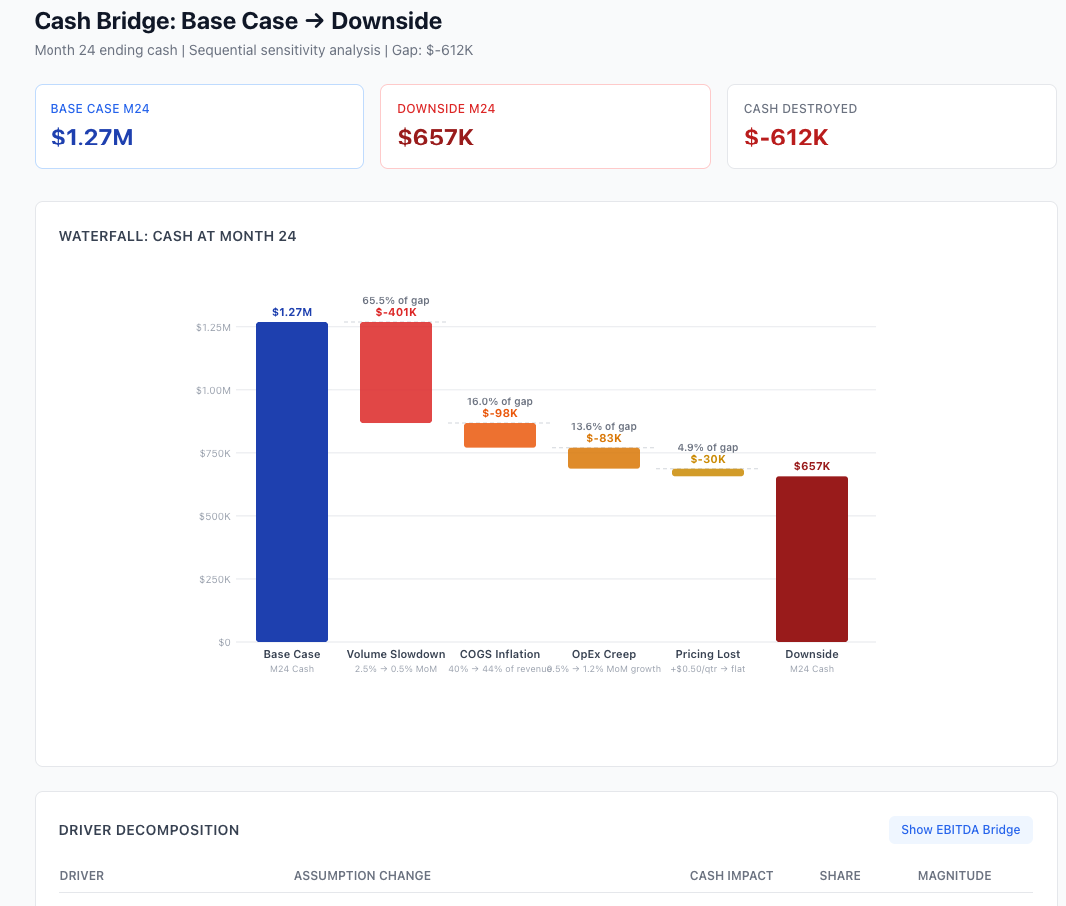
The spread between upside and downside at Month 24: $1.15M in ending cash. The waterfall breaks it down. Volume slowdown accounts for 65% of the gap. COGS inflation takes 22%. OpEx and pricing split the rest.
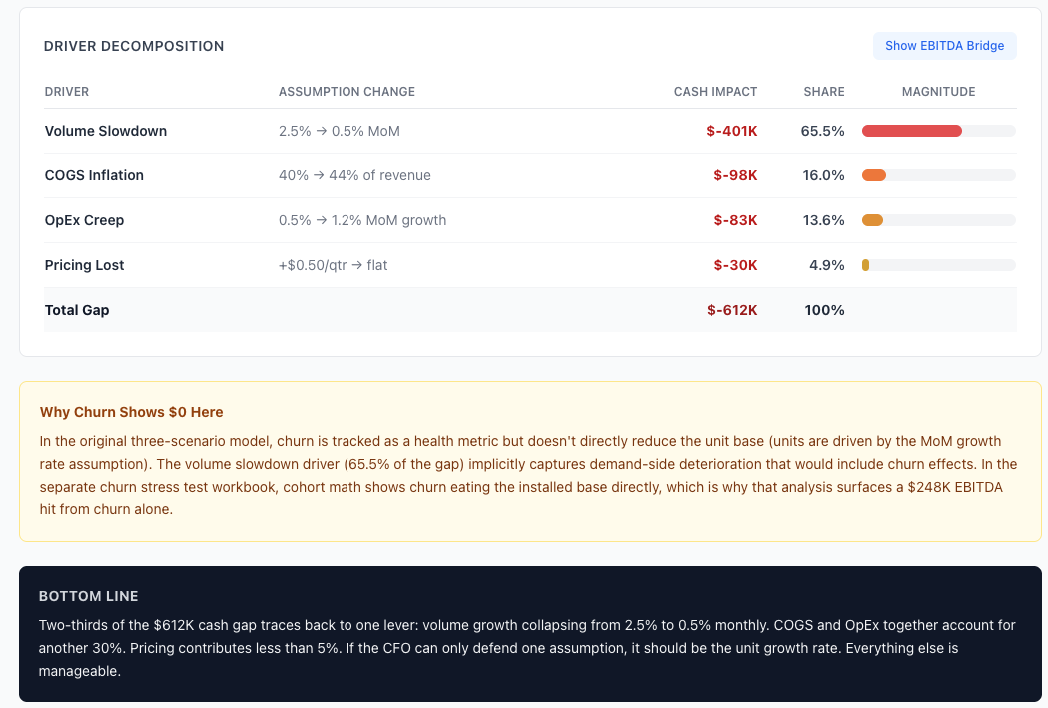
If your business can only defend one assumption, it should be the growth rate. Everything else is manageable by comparison.
Step 3: Stress-test what keeps you up at night
For this SaaS business, the scary number is churn. We asked Claude a simple question:
PROMPT
What happens if churn hits 5% by Month 12?Claude ran a cohort-based stress test where churn eats directly into the installed base. Over 24 months, it wiped out $413K in revenue and $248K in EBITDA.
That’s 22% of the company’s total EBITDA, gone.
But the number that actually changes decisions is customer lifetime.
At the base case churn of 2.9%, the average customer sticks around for 34 months. Push churn to 5% and that drops to 20 months. If your sales and marketing spend assumes customers stay for 30 months, a churn spike turns those investments upside down overnight.
Claude also flagged something useful: if monthly churn crosses 3.5% for two months in a row, you’re about 6 months away from hitting the stress scenario. That’s your early warning signal.
Step 4: Model the scenario nobody wants to talk about
We asked Claude to model losing the top 3 customers at Month 6. Combined, they represent about 22% of revenue.
PROMPT
Add a black swan scenario: we lose our top 3 customers.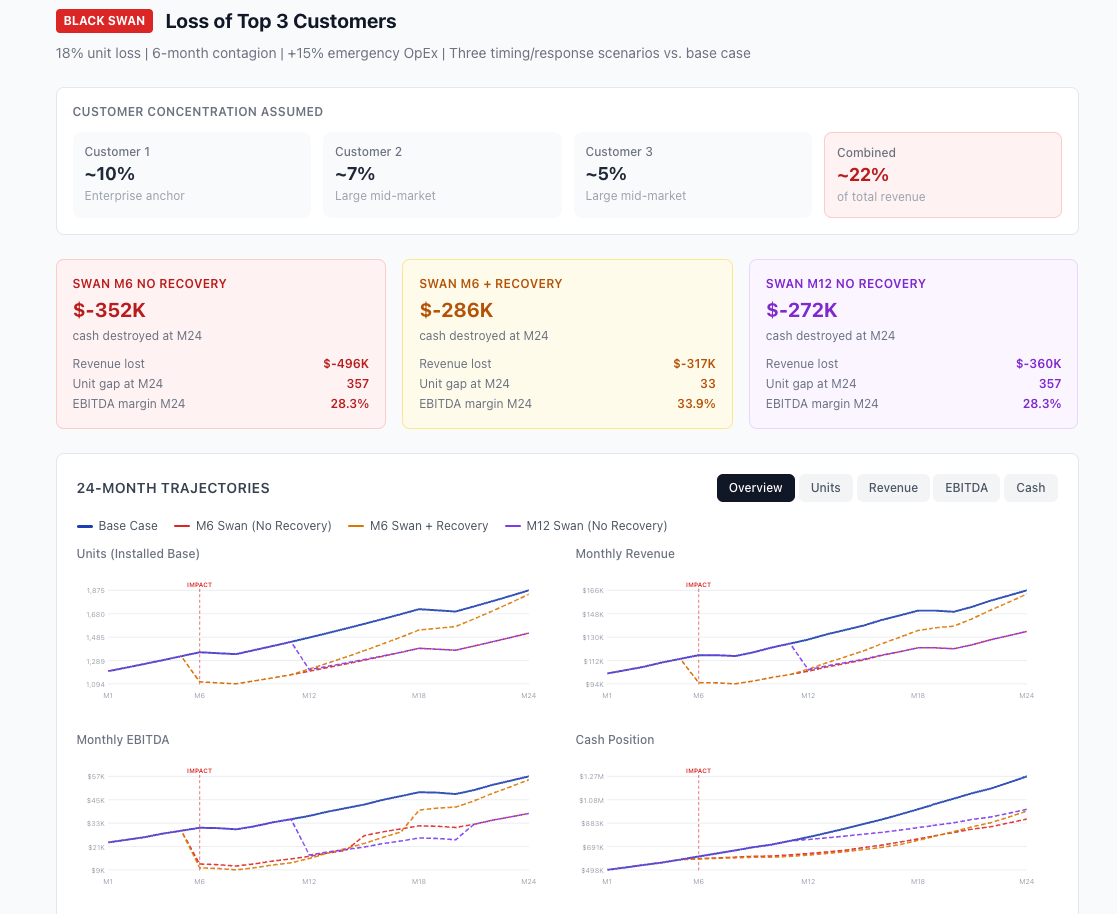
Without a recovery effort: $352K in EBITDA destroyed. Units dropped from 1,358 to 1,111 overnight and took 11 months to rebuild. The revenue from that window is gone permanently.
With an aggressive recovery push (4% monthly growth target, 20% OpEx surge), the unit gap closed faster, but the EBITDA damage was only $65K less. You’re spending money to replace revenue you already had.
The real takeaway was at the bottom of the dashboard: a concentration risk playbook. Stagger contract renewals across quarters. Build health scores. Keep a 6-month cash reserve covering top-3 revenue.
These are the actions that prevent the scenario, not just model it.
Step 5: Make the actual decision
This is where scenario analysis stops being academic. We asked the question every growing company faces:
PROMPT
Can we afford 3 more heads in Q2, or only if the upside materializes? Show me the impact across all three scenarios.Claude modeled 3 FTEs at $130K fully loaded, starting Month 4.
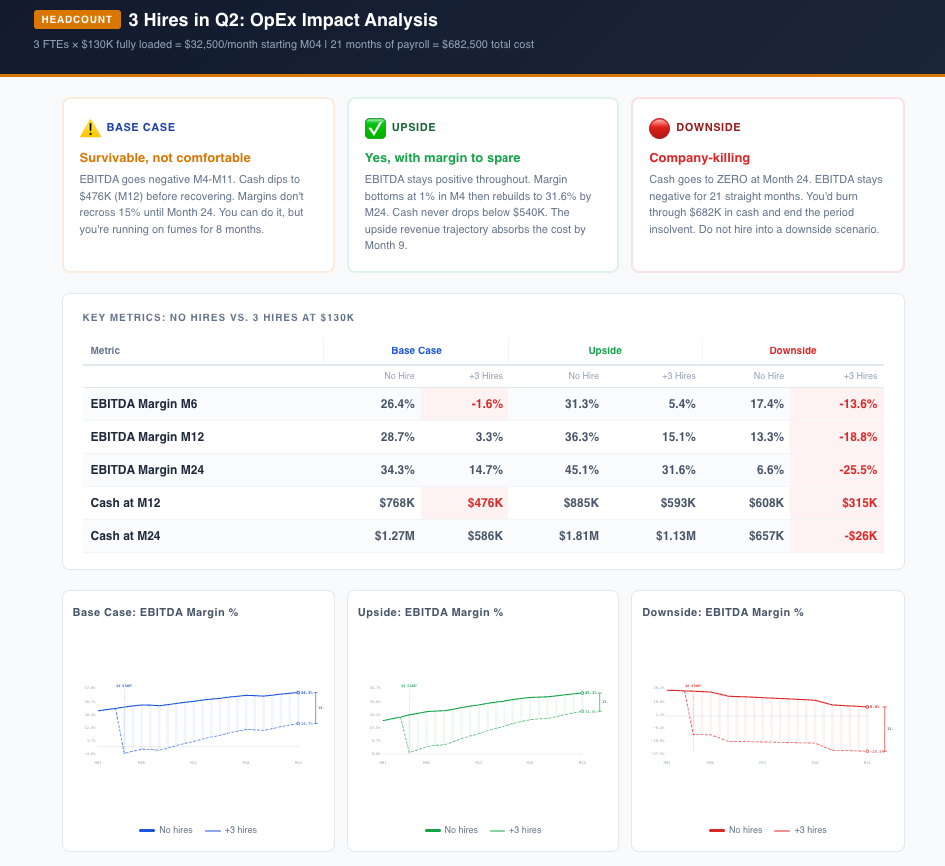
If the business tracks upside, all three hires work.
Margin dips briefly, rebuilds to 31.6% by Month 24, and cash never drops below $540K.
The base case is where it gets uncomfortable. EBITDA goes negative for 8 consecutive months while the business absorbs the cost. You survive, but you burn through $682K that was otherwise building toward a strategic reserve.
And if the downside plays out, three hires destroy the company.
Cash hits zero and EBITDA stays negative for 21 straight months.
Claude’s recommendation was specific: hire 2 now, and gate the third on a trigger. Trailing 3-month revenue growth has to exceed 3% month-over-month before the third requisition opens. That threshold confirms you’re tracking the upside, which is the only scenario that absorbs all three comfortably.
Step 6: Package it for the board
PROMPT
What EBITDA range can we show the board? How much leverage could this business carry at each scenario?”
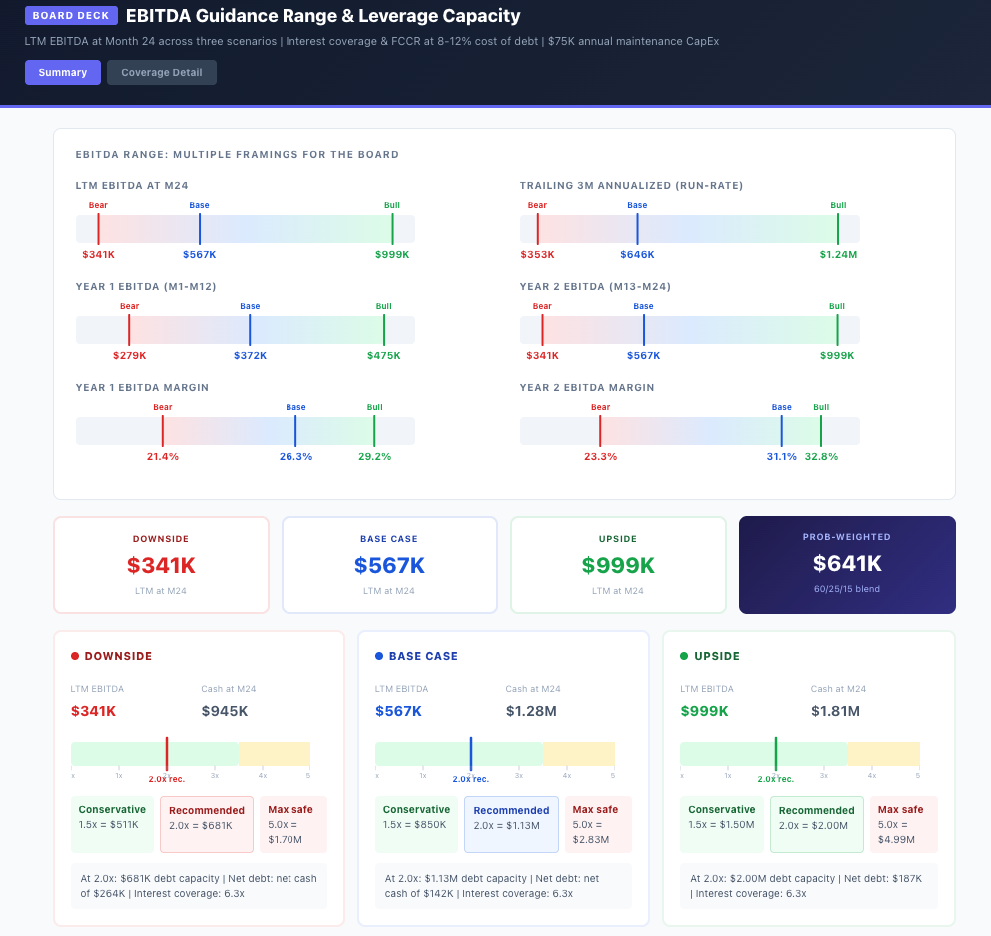
Claude produced EBITDA ranges across multiple framings, a probability-weighted figure ($641K blending base, upside, and downside), and leverage capacity at 2.0x with interest coverage for each scenario.
The board summary: a guide to $567K LTM EBITDA with a $341K-$999K range. 2.0x leverage ceiling gives $1.1M of firepower while maintaining 6.2x coverage even in the bear case.
The Bottom line
We ran this entire exercise in a single afternoon.
The scenario dashboard, the churn stress test, the black swan, the headcount decision, and the board-ready guidance. All of it. And the part that surprised us wasn’t the speed. It was the follow-up questions.
In a normal workflow, each of those analyses is a separate request, a separate model, and a separate week. You finish the scenario comparison and then leadership asks about churn sensitivity and you’re back in the spreadsheet for two more days. Here, we just kept asking.
Each question built on the last, and Claude carried the full context forward.
The thinking is still yours. Which scenarios matter, which assumptions to challenge, and what the numbers mean for the business. That doesn’t change. What changes is that the gap between having the question and seeing the answer shrinks from days to minutes.
If you want to try this yourself, export your operating data as a CSV and upload it to Claude with the prompts we used above. Swap in your own assumptions. Ask the follow-up questions your CFO would ask. Make sure your environment is secure.
You might be surprised how much of your quarterly planning cycle fits inside a single conversation.
Next week we’ll run another FP&A workflow through AI. If there’s something specific you want us to test, reply and tell us.
P.S. Advertise with the AI FP&A Office.

The AI FP&A Office is presented to you by Paul Barnhurst, Glenn Hopper, Wouter Born and Ali Bilawal. We take real FP&A problems, run them through AI, and show you what comes out.
Any chance you would share how the data you provided was structured? A few example rows? Data structure and cleanliness is one of the biggest issues slowing AI adoption for our company.
The first 40 seconds basically summarized what I go through at least twice a year at my current job